THE REPUBLICAN REVERSAL
  • Book
  • Timeline
  • Chapters ▼
    • Ch. 1: Conservatives Before and After Earth Day
    • Ch. 2: Visions of Abundance
    • Ch. 3: The Cost of Clean Air and Water
    • Ch. 4: American Exceptionalism in a Warming World
    • Conclusion
  • Data ▼
    • Republican Party Environmental Platforms since 1972
    • Campaign Donations
    • EPA Budget Histories
    • Statistics on Air Pollution
    • National Forest Timber Cut Volume
    • Congressional Votes on Bills
    • Public Opinion
  • News
  • About

STATISTICS ON AIR POLLUTION

With the passage of the Clean Air Act in 1970 and later legislation, such as the Clean Air Act Amendments of 1990, total emissions of pollutants such as nitrogen oxide, sulfur dioxide, and carbon monoxide decreased significantly. To learn more about air quality standards and pollution reduction, visit the EPA’s website on air pollutant emissions trends. The data set used to generate the graph below is the Average Annual Emissions for criteria pollutants.
Picture
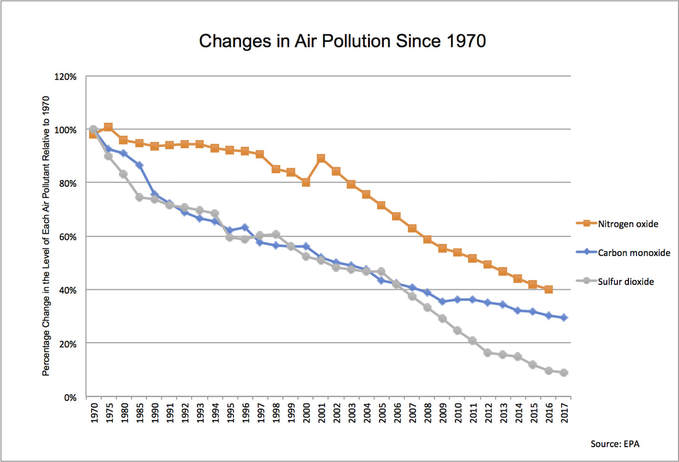
Source: Air Emissions Inventories: Air Pollutant Emissions Trends Data, “Average Annual Emissions,” EPA, 2017
Proudly powered by Weebly